Campaign statistics
- Prompt reports
- Multilevel reports
- Report presentation
- Page navigation
- Search
- Reports export
- Filters
- Subtracting a row from the total sum
- Marking rows
- Video
To open the campaign statistics, select a campaign and click Report, or just double click a campaign.
Prompt reports
The prompt reports panel looks like this:

-
Available reports
-
Name Description Campaigns Campaigns statistics (available in group statistics) Campaigns Group Campaign groups statistics (available in group statistics) Paths Main paths statistics Offers Offers statistics Landers Landing pages statistics Rules Rules statistics Rotations Rotations statistics ISP Internet service providers statistics IP IP addresses and ranges Device Device type, brand, name, model, screen resolution Browser Browsers and versions OS OSs and versions Country Countries statistics City Cities statistics Language Languages statistics Aff. Network Affiliate networks statistics Referer Referer (domain and full URL) Day of week Statistics over days of week Hour of day Statistics over hours Days Statistics over days within a selected time period Tokens Available tokens statistics CPC Cost per click statistics Conversion status Conversion status statistics Uniqueness Counts unique and non-unique clicks Events Events statistics Leads Leads statistics As soon as you select a metric, Binom will load a report.
-
Multilevel reports
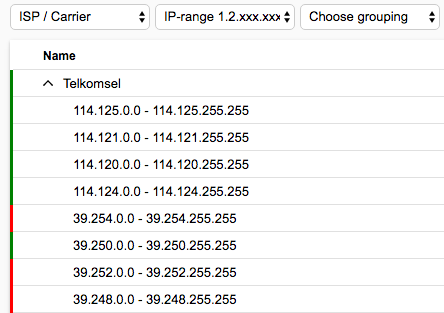
If you need to get the more in depth statistics, like both on ISP and IP ranges, select a grouping you want in the dropdown menu. For example:
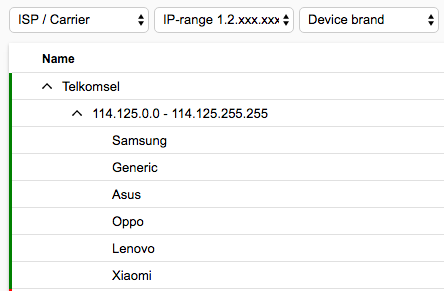
Let's also group by device:
One of the key features of Binom is that the reports are generated immediately. This speed doesn't depend on the current traffic volume, total number of clicks in the database or in the campaign. Thousands of pages also load in seconds. It's good for analyzing your traffic, you can wrap and unwrap the groupings.
Report presentation
You can choose a report presentation. To do this, click Show Chart and select a presentation.
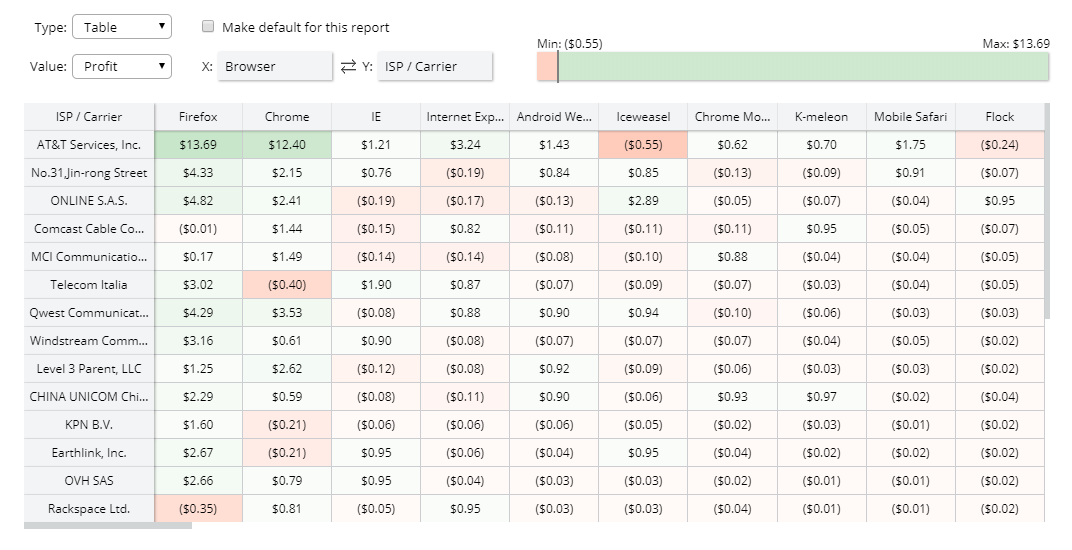
Table
A table presentation, which helps you see the best bindings of two different groupings by ROI, CR, Costs, and so on.
Chart
A chart, like the one on the Trends tab.
Pie
A pie chart, which is good to display the overall statistics.
Page navigation
At the bottom of each report, there is a page navigation menu:
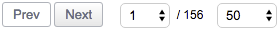
You can go to the next/previous page of the report, or select an exact page. You can also set the number of lines on a page (from 50 to 1000), or display the whole report on one page.
Search
Use the Search field to find an exact value. Keep in mind, that you can search only in the first grouping.
Reports export
Click Export and select an option:
CSV — download a .csv file with the report
TXT — download a .txt file with the Name column of the report (useful in the case of blacklists and whitelists)
Clipboard — copy the report to the clipboard
Filters
Simple filters
To apply filter to a report, click Filters > New filter:
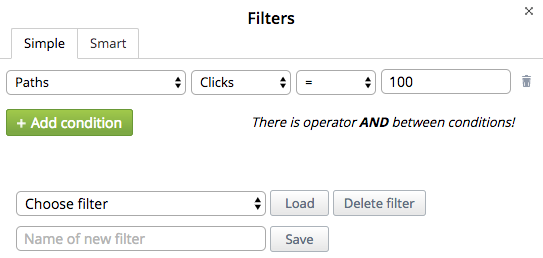
Now you can create a filter with several conditions. Select a grouping (one of three), column, operator, and value.
To add a new condition, click Add condition. There's an AND operator between the conditions, which means all the conditions will be met. To apply a filter, click Apply or enter its name in the Name of filter field and click Apply & Save. This way you will add the filter to the Filters menu and be able to use it whenever you want. You can edit or delete the saved filters, just click a related icon opposite the name of a filter.
You can also use the saved filters in our API.
Smart filters
These are the filters which help you get an accurate blacklist or whitelist based on EPC (with the mean accuracy of 95%).
For example you want to create a whitelist with the 0.003 bid. To do this, go to Filters > New filter > Smart, select Whitelist, specify 0.003 in the EPC > field and click Apply. Binom will pick out all the publishers with EPC > 0.003.
Subtracting a row from the total sum
When viewing a report, click any row to subtract all its values from the total amount.
Marking rows
You can mark publishers that you sent to the blacklist/whitelist, mark the ads/OSs/traffic types.
To mark a row of a report, select it, then select an icon at the top of the table. To mark all rows, select a checkbox to the left of the Name column, then select the icon you want.
If you want to display only rows marked with a specific icon, just click that icon (without selecting a row).
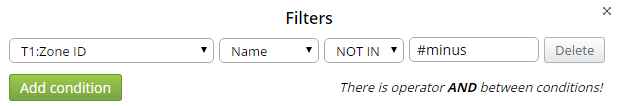
You can search by icon tags: #cross, #minus, #plus, #check, #star, #pause, #delete. You can also use these tags in the API, in the search_name parameter.
Keep in mind, that only rows in tokens reports can be marked.
If you want to display all rows in a report, except the ones marked with a special icon – use the following filter:
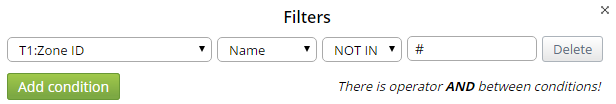
You can display all unmarked rows like this:
Video