Trends
Trends show the statistics of campaigns / traffic sources / users over a specified time period.
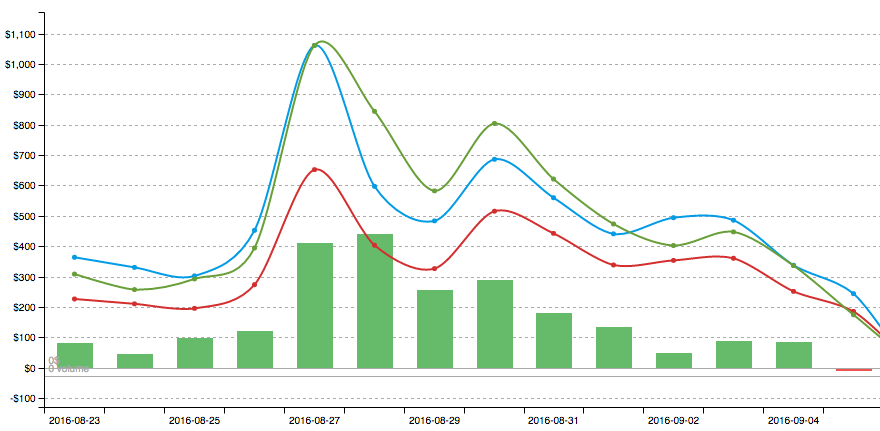
You can view it as a chart or a table. Trends help you track your progress on workflows.
Navigation menu
To open trends, click the Trends tab.
By default, trends are loaded as a table. To view a graphic display, click Chart.

From left to right:
— User statistics (the field appears if there are additional users in the tracker)
— Campaign status statistics
— Campaign group statistics
— Traffic source statistics
— A time step: hours, days, weeks, months
— The statistics timeframe
Keep in mind, that the statistics are not live. To update the statistics, click Refresh.
Want to help us improve this documentation page? Create a pull request